Home > Research & Publications > personalized drug resistance prediction model
Personalized prediction of EGFR mutation-induced drug resistance in lung cancer
Abstract
EGFR mutation-induced drug resistance has significantly impaired the potency of small molecule tyrosine kinase inhibitors in lung cancer treatment. Computational approaches can provide powerful and efficient techniques in the investigation of drug resistance. In our work, the EGFR mutation feature is characterized by the energy components of binding free energy (concerning the mutant-inhibitor complex), and we combine it with specific personal features for 168 clinical subjects to construct a personalized drug resistance prediction model. The 3D structure of an EGFR mutant is computationally predicted from its protein sequence, after which the dynamics of the bound mutant-inhibitor complex is simulated via AMBER and the binding free energy of the complex is calculated based on the dynamics. The utilization of extreme learning machines and leave-one-out cross-validation promises a successful identification of resistant subjects with high accuracy. Overall, our study demonstrates advantages in the development of personalized medicine/therapy design and innovative drug discovery.
Results
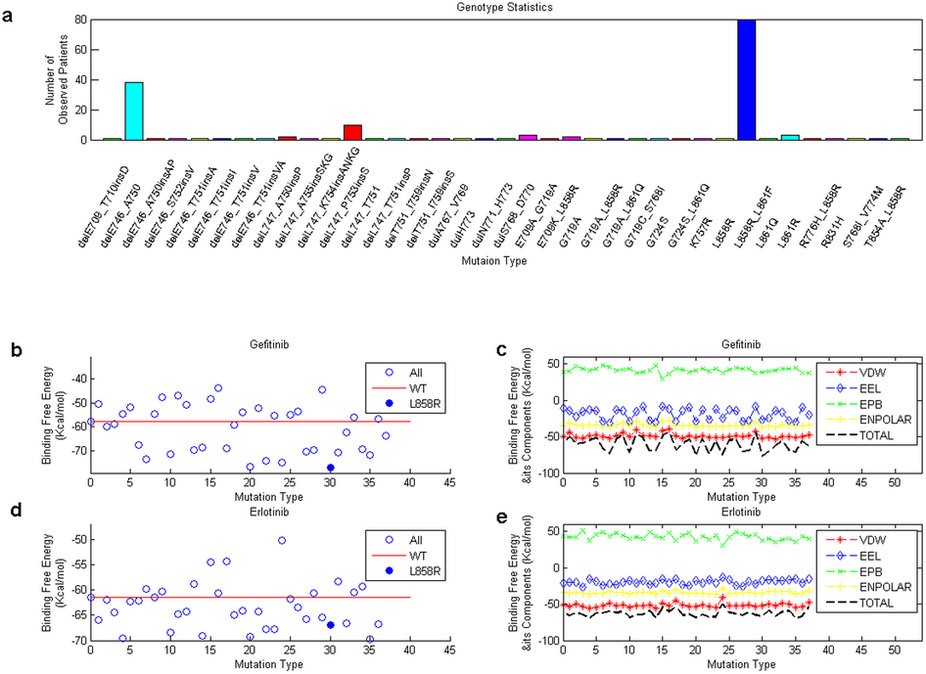
Figure 1: Statistics on mutation types and their binding free energies with the two inhibitors. Part (a) shows the statistics of the 37 mutation types of our observed 168 patients. Parts (b) and (d) present the distributions of total binding free energies of the mutants (with WT protein included) with two inhibitors gefitinib and erlotinib. The red lines and solid blue circles show the binding free energy for the WT EGFR and the L858R mutant respectively. Parts (c) and (e) display the distributions of the binding free energy components, which encompass VDW, EEL, EPB and ENPOLAR, for the two inhibitors.
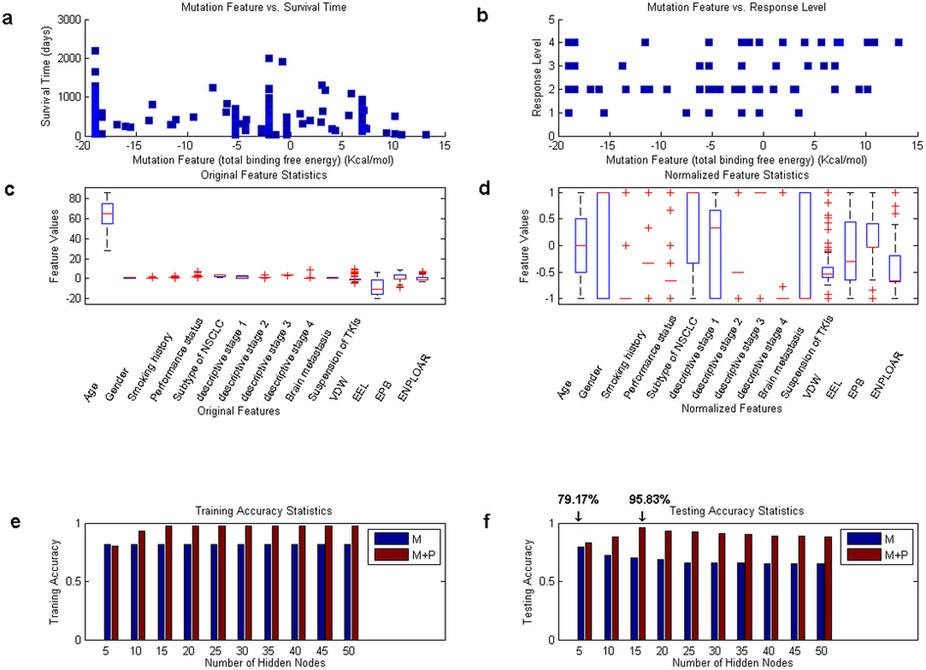
Figure 2: Statistics on features and classification results of the clinical subjects. Part (a) shows the distribution of mutation feature (total binding free energy) vs. survival time for the 168 clinical subjects, with each point representing one subject. Similarly, the plot of mutation feature vs. response level is displayed in part (b). The distributions of the adopted features (personal + mutation) for the 168 subjects are shown in parts (c) and (d), with part (c) showing the original distribution while part (d) the normalized values. Part (e) provides a comparison between the training accuracies reported in the case involving the mutation feature only (blue, denoted as ‘M’) and the case involving both mutation feature and personal features (brown, denoted as ‘M + P’). Part (f) shows a comparison between the testing accuracies (blue for the first case, and brown for the second).
Table 1: Classification results with different settings. This table shows the prediction results of the response level to the specific inhibitors for the observed patients. Two feature sets, one including the mutation feature only while the other involving both the mutation feature and personal features, are applied for a comparison. Extreme learning machines and leave-one-out cross validation are used in the calculation. The number of hidden nodes varies from 50 to 500 at a step of 50, and the accuracy are shown in the table.
| Mutation feature | Mutation feature + Personal features | |||
|---|---|---|---|---|
| Number of Hidden Nodes | Training Accuracy (average) | Testing Accuracy (average) | Training Accuracy (average) | Testing Accuracy (average) |
| 50 | 0.8155 | 0.7917 | 0.8004 | 0.8333 |
| 100 | 0.8155 | 0.7262 | 0.9303 | 0.881 |
| 150 | 0.8155 | 0.7024 | 0.9762 | 0.9583 |
| 200 | 0.8155 | 0.6845 | 0.9762 | 0.9286 |
| 250 | 0.8155 | 0.6607 | 0.9762 | 0.9226 |
| 300 | 0.8156 | 0.6607 | 0.9763 | 0.9107 |
| 350 | 0.8155 | 0.6607 | 0.9762 | 0.9048 |
| 400 | 0.8154 | 0.6488 | 0.9763 | 0.8869 |
| 450 | 0.8156 | 0.6488 | 0.9762 | 0.8869 |
| 500 | 0.8155 | 0.6488 | 0.9763 | 0.881 |